
In-field test engineers constantly face obstacles with interference signals being too weak when monitoring mobile phone interference in urban areas. Such signals are often below the noise floor of the measuring instrument, for example, a spectrum analyzer.
How Does Dynamic Range Affect a Spectrum Analyzer?
Instruments like a spectrum analyzer will rely on a high dynamic range to cut through unwanted artifacts. Harmonics and intermodulation can rise above the noise floor and hurt the performance of a spectrum analyzer. Understanding the parameters that make up dynamic range can not only help to ensure a spectrum analyzer is working correctly, but also offers key information on all instruments which should meet ITU guidelines.
Certain steps can help improve sensitivity, like reducing reference levels, input attenuation, or resolution bandwidth (RBW). Devices, like a spectrum analyzer preamplifier, can also reduce those low noise issues. And while these changes can lower the noise floor of the machine, they can also drop the device's immunity to stronger signals. Those stronger signals can have a ripple effect on the device, starting with operation in nonlinear regions. The device may create interference, harmonics, and intermodulation products. Second harmonics can also occur, operating at double the frequency of an input signal. The device will show these as an actual signal, which may appear to be an interfering transmitter in the network (See
Figure 1).
Dynamic Range
A high dynamic range offers a solution for these false signals. With a high dynamic range, spectrum analyzers and other test instruments can conceal or decrease second harmonics.
Dynamic range is the area where the minimum to maximum strength signals can be detected and measured before artifacts appear above the noise floor. Generally, a higher dynamic range comes when this area is larger or the amplitude of the artifacts is smaller. High dynamic range also reduces the chances that these artifacts, like harmonics, are mistaken for real signals. Ideally, an instrument will have a higher intermodulation free dynamic range (IMFDR). A device's IMFDR is the dynamic range where unwanted intermodulation is still below the noise floor.
The term high dynamic range (HDR) is often applied to both spectrum analyzers and radio receivers. Even with large signals in the area, a device with HDR can register those small signals. To achieve HDR, the spectrum analyzer first needs high sensitivity for signals at a small level. The device also needs an ability to cut through congestion caused by those large signals.
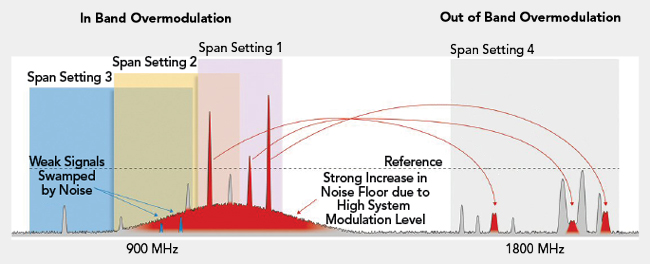 Figure 1 Operation in nonlinear regions can cause spikes like harmonics and other artifacts, which appear as if they are real signals.
While a high dynamic range is crucial for spectrum analyzers, there's also a need for flexibility. Depending on the needs for a higher or lower signal level, the dynamic range can change. And when working in nonlinear regions, those unwanted artifacts can further hurt the dynamic range. Two artifacts in particular deserve consideration when using a spectrum analyzer: harmonics and intermodulation.
Harmonics - As mentioned above, second harmonics occur at twice the frequency of an input signal. Higher-order (i.e., nth-order) harmonics occur at n times the frequency of the input. Harmonics can only occur when a signal is present, usually when radiofrequency components in the device work with an increased power level in nonlinear regions.
Intermodulation - Another artifact from an RF component working in nonlinear regions in intermodulation. But, unlike harmonics, intermodulation mixes two or more signals to make a new input frequency. For example, the second-order intermodulation frequencies of the frequencies f1 and f2 are f1 + f2 and f2 – f1 and the third-order intermodulation frequencies are 2f1 + f2, 2f2 + f1, 2f1 – f2 and 2f2 – f1.
Signal Levels
Artifacts will also greatly change depending on how the input signal changes. For example, the dB of a second-order artifact will change by double the size of the input change. A third-order artifact will similarly triple the change of an input signal change.
Intercept points also differ based on the instrument's dynamic range and input attenuation. This is how intercept points are presented, depending on the artifact:
- IP2/SOI: the second-order intercept point, based on the intermodulation products.
- IP3/TOI: The third-order intercept point, based on the intermodulation products.
- SHI: The second-order intercept point, based on harmonics.
- THI: The third-order intercept point, based on harmonics.
The values for IP2/SOI, SHI, IP3/TOI, and THI automatically change with the input attenuation of the instrument. To maintain accuracy, the dynamic range and related specifications should do the same.
Intercept Points
Output power, and its related harmonics, directly reflect input power. As the input power increases with that linear relationship, output signal power will intersect with the artifact's level. When it comes to third-order intermodulation, that intercept point is called the TOI or IP3. At this point, the signals are equal, with the level difference and dynamic range between third-order artifacts and target signal at 0 dB.
The other intercept points have similar names and definitions: IP2/SOI, SHI, and THI. SHI represents dynamic range when a single strong signal that creates harmonics interferes with the measurement of a weak signal. THI occurs when two or more strong input signals cause harmonics that interfere.
Intercept points will vary depending on factors like second- or third-harmonics and intermodulation.
DANL
Intercept points aren't the only key aspect to the IMFDR of an instrument. The other factor displayed averaged noise level (DANL). The measuring system for an instrument depends on its natural noise. A lower noise floor results in a greater dynamic range. System sensitivity, RBW setting, and thermal noise will all affect the DANL.
To find a dynamic range, instrument settings should be the same whether testing for IP2, IP3, DANL, or noise figure (NF).
ITU Recommendations
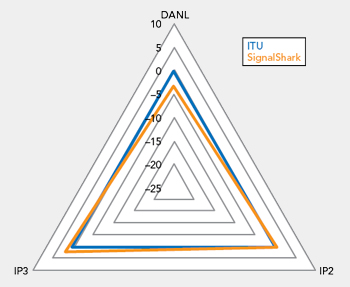 Figure 2 The triangle plots the DANL, IP2, and IP3 performance of a SignalShark spectrum analyzer compared to ITU recommendations.
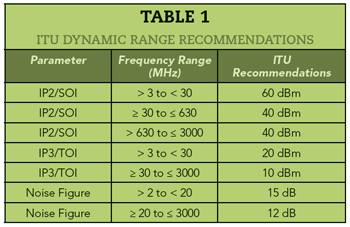
Thanks to the International Telecommunication Union (ITU), there are guidelines to determine a dynamic range. While their guidelines don't specifically cover spectrum analyzers, they detail parameters and absolute values for frequency ranges.
There are some simple ways to represent the ITU's recommendations, like in
Table 1 above. Although, other figures can make dynamic range and its related parameters easier to read. The triangle to the right offers figures like DANL, IP2, IP3, and dynamic range. A larger triangle means a better dynamic range, creating a figure that's better to compare performance.
To the right in
Figure 2, we see both an ideal performance based on ITU recommendations and the performance of the
SignalShark spectrum analyzer. Parameters for the SignalShark come from
Narda Safety Test Solutions. The SignalShark has an NF of 15dB, higher than the ITU recommended 12 dB. Narda's spectrum analyzer also surpasses ITU recommendations for IP3 by 2 dB, while nearly matching the IP2 above 20MHz.
A high dynamic range may be crucial to spectrum analyzer performance, but many factors make up that information. DANL, IP2, IP3, and their relationships to ITU guidelines offer key information on a dynamic range. With these figures and the triangle diagram to the right, users can better understand spectrum analyzers and other instruments that rely on a high dynamic range.
Sources:
Microwave Journal