

Ask us about
test equipment solutions for your industry
What Is the 1 dB Compression Point (P1dB) and Why Does It Matter?


What is P1dB Compression?
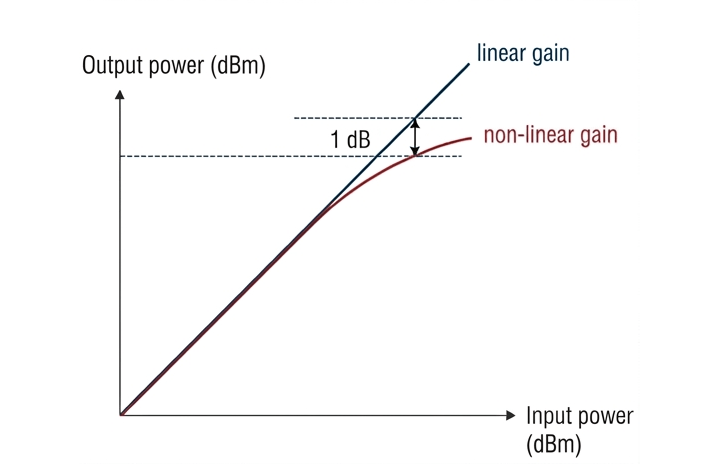
When an amplifier is provided an input signal (or input power), the ideal result is that the output signal (or output power) remains at a fixed dBm ratio. This is known as the linear region of an amplifier. In the linear region, the amplifier increases the input signal by a specific amount, known as its gain, while maintaining the same rate of change between the input and output signals.
Mathematically, this relationship can be expressed as:
Output Power = Input Power + Gain
Output signals do not always maintain the same rate of change as the input signal. As the input power increases, a point is eventually reached where the amplifier can no longer maintain its linear response. This is when compression begins.
Compression is the transition from linear to non-linear operation, occurring when a device can no longer maintain a proportional relationship between input and output power. At this point, signal distortion begins to occur. The most common way to quantify this behavior is by identifying the 1 dB compression point (P1dB), which is the point where the output power is 1 dB lower than the expected linear value.
Understanding the P1dB compression point is important because it provides a practical indication of an amplifier's linear operating range and helps engineers evaluate device performance before significant distortion occurs.
Mathematically, this relationship can be expressed as:
Output Power = Input Power + Gain
Output signals do not always maintain the same rate of change as the input signal. As the input power increases, a point is eventually reached where the amplifier can no longer maintain its linear response. This is when compression begins.
Compression is the transition from linear to non-linear operation, occurring when a device can no longer maintain a proportional relationship between input and output power. At this point, signal distortion begins to occur. The most common way to quantify this behavior is by identifying the 1 dB compression point (P1dB), which is the point where the output power is 1 dB lower than the expected linear value.
Understanding the P1dB compression point is important because it provides a practical indication of an amplifier's linear operating range and helps engineers evaluate device performance before significant distortion occurs.
How P1dB Compression Is Measured
P1dB, or the 1 dB compression point, can refer to either the output power level (OP1dB) or the input power level (IP1dB). In a typical compression curve, OP1dB is represented on the y-axis while IP1dB is represented on the x-axis.
Mathematically, the relationship can be expressed as:
OP1dB = IP1dB + Gain − 1
This is not the only way to represent P1dB data. Another common approach is to plot gain instead of output power.
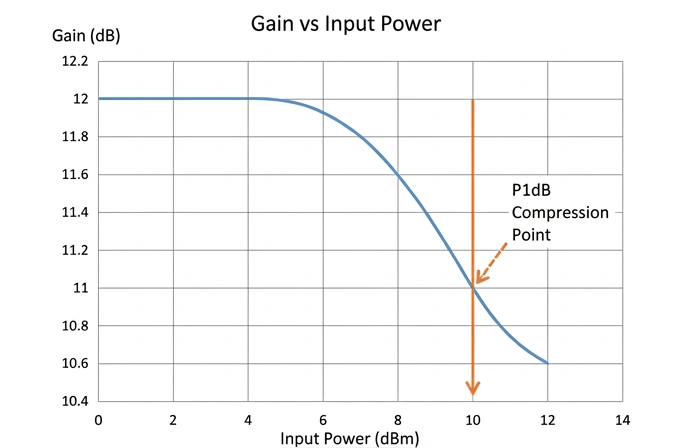
In this type of graph, gain remains constant while the amplifier is operating in its linear region. Since gain is the difference between the input and output signals, any reduction in gain indicates the onset of compression. When the measured gain is 1 dB lower than the expected gain, the amplifier has reached its P1dB compression point.
Gain-compression plots are commonly used when displaying measurement results and calculating P1dB because they make it easier to visualize the reduction in gain that occurs as compression begins.
Mathematically, the relationship can be expressed as:
OP1dB = IP1dB + Gain − 1
This is not the only way to represent P1dB data. Another common approach is to plot gain instead of output power.
In this type of graph, gain remains constant while the amplifier is operating in its linear region. Since gain is the difference between the input and output signals, any reduction in gain indicates the onset of compression. When the measured gain is 1 dB lower than the expected gain, the amplifier has reached its P1dB compression point.
Gain-compression plots are commonly used when displaying measurement results and calculating P1dB because they make it easier to visualize the reduction in gain that occurs as compression begins.
What Does P1dB Represent?
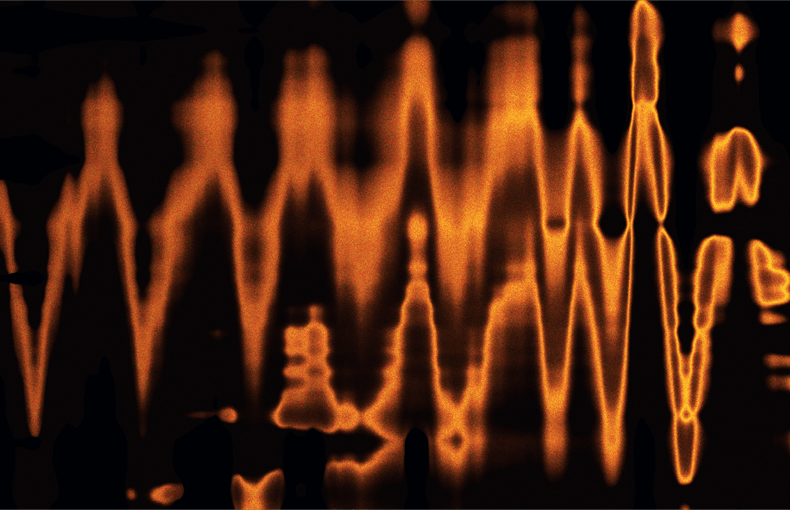
P1dB represents a compression point within a device under test (DUT), identifying when the DUT transitions from linear operation to non-linear operation. Compression is generally undesirable because it introduces harmonics and intermodulation products that distort the signal.
For example, consider a signal generator providing an input signal to an amplifier. Under normal operating conditions, the amplifier's output should simply be a higher-amplitude version of the original signal. When compression occurs, however, the output signal becomes distorted and no longer follows the expected linear relationship with the input signal.
For this reason, P1dB is often used as an indicator of a DUT's linearity, dynamic range, and power-handling capability. It provides a standardized way to compare amplifier performance and determine useful operating limits.
It is important to note that P1dB is a convention rather than a strict rule. Distortion can occur before, at, or after the 1 dB compression point depending on the device and application. In some cases, alternative compression values may provide a more accurate representation of performance. For example, P2dB and P3dB are commonly used for high-power amplifiers, while P0.25dB is often used for diodes and voltage-variable attenuators.
For example, consider a signal generator providing an input signal to an amplifier. Under normal operating conditions, the amplifier's output should simply be a higher-amplitude version of the original signal. When compression occurs, however, the output signal becomes distorted and no longer follows the expected linear relationship with the input signal.
For this reason, P1dB is often used as an indicator of a DUT's linearity, dynamic range, and power-handling capability. It provides a standardized way to compare amplifier performance and determine useful operating limits.
It is important to note that P1dB is a convention rather than a strict rule. Distortion can occur before, at, or after the 1 dB compression point depending on the device and application. In some cases, alternative compression values may provide a more accurate representation of performance. For example, P2dB and P3dB are commonly used for high-power amplifiers, while P0.25dB is often used for diodes and voltage-variable attenuators.
Equipment Used for P1dB Testing
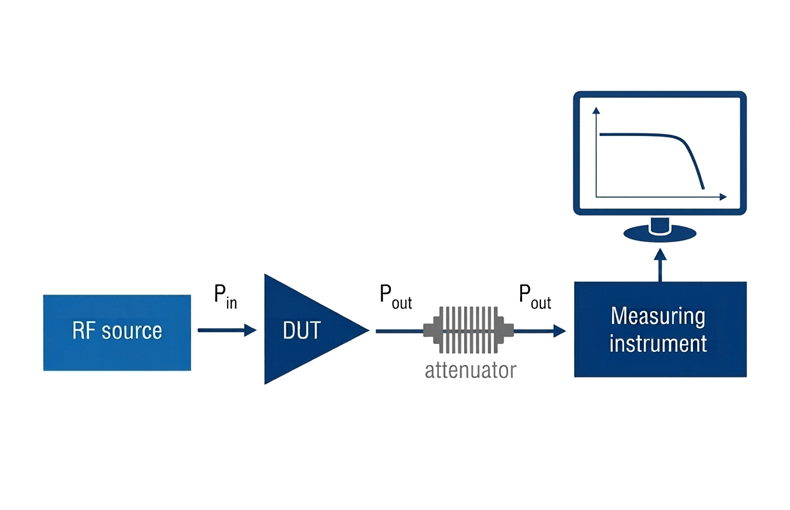
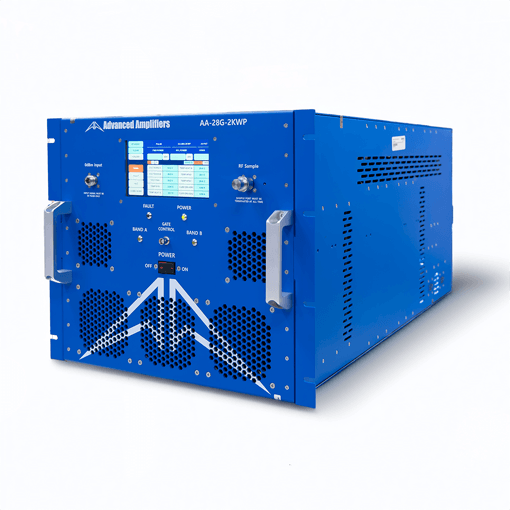
Testing the P1dB compression point requires four basic functions: generating an input signal, applying that signal to the DUT, measuring the output signal, and recording or displaying the results. Several test setups can be used to accomplish this.
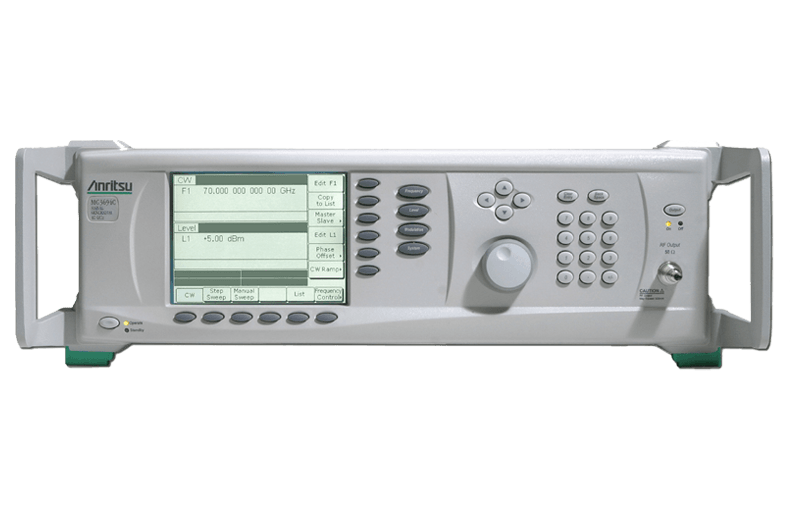
One common setup uses a signal generator, a DUT, and a power sensor. In this configuration, the signal generator provides the input signal, the DUT processes the signal, and the power sensor measures the output power with a high degree of accuracy. The resulting measurements are then recorded manually or through a computer-based application to generate a compression curve.
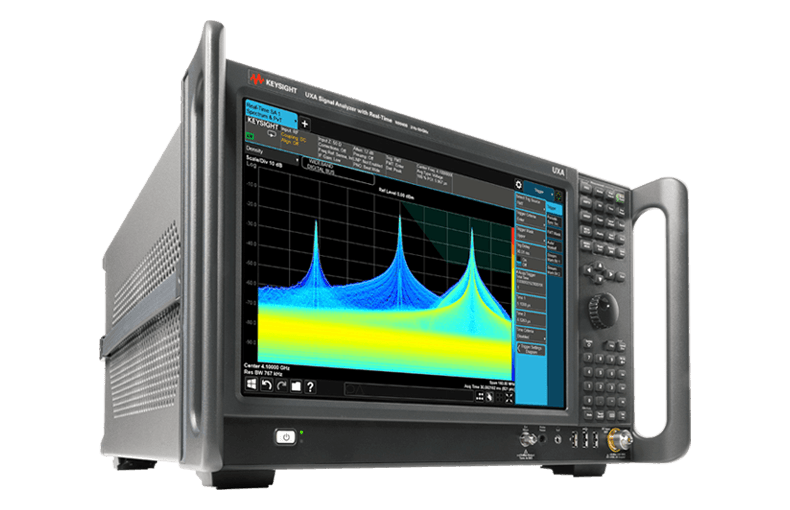
Another setup replaces the power sensor with a spectrum analyzer. The signal generator still provides the input signal, but the spectrum analyzer measures, displays, and records the DUT's output signal. This setup simplifies data visualization while still providing accurate compression measurements.
A third option uses a vector network analyzer (VNA). In this configuration, the VNA generates the input signal, measures the output response, and plots the resulting data. Because VNAs combine signal generation and measurement capabilities into a single instrument, they are commonly used for amplifier characterization, gain compression measurements, and RF testing applications.
One common setup uses a signal generator, a DUT, and a power sensor. In this configuration, the signal generator provides the input signal, the DUT processes the signal, and the power sensor measures the output power with a high degree of accuracy. The resulting measurements are then recorded manually or through a computer-based application to generate a compression curve.
Another setup replaces the power sensor with a spectrum analyzer. The signal generator still provides the input signal, but the spectrum analyzer measures, displays, and records the DUT's output signal. This setup simplifies data visualization while still providing accurate compression measurements.
A third option uses a vector network analyzer (VNA). In this configuration, the VNA generates the input signal, measures the output response, and plots the resulting data. Because VNAs combine signal generation and measurement capabilities into a single instrument, they are commonly used for amplifier characterization, gain compression measurements, and RF testing applications.
Why P1dB Is Important in RF and Amplifier Testing?
P1dB remains one of the most widely used measurements in RF and microwave testing because it provides a practical indication of when a device begins operating outside its linear region.
Engineers use P1dB measurements to evaluate amplifier performance, determine operating margins, compare devices, and identify the onset of distortion. Understanding the compression point helps ensure that a device operates within its intended range and maintains acceptable signal quality.
Whether designing a new system, validating performance, or troubleshooting an existing application, the 1 dB compression point provides valuable insight into a device's real-world behavior.
Engineers use P1dB measurements to evaluate amplifier performance, determine operating margins, compare devices, and identify the onset of distortion. Understanding the compression point helps ensure that a device operates within its intended range and maintains acceptable signal quality.
Whether designing a new system, validating performance, or troubleshooting an existing application, the 1 dB compression point provides valuable insight into a device's real-world behavior.
How ATEC Can Help with P1dB Testing
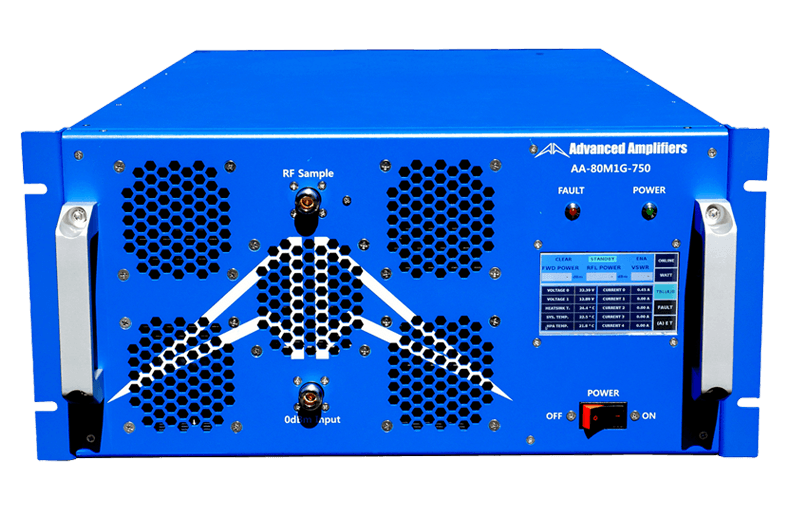
If you are performing P1dB compression testing, ATEC rents the equipment needed to characterize amplifier linearity and compression performance, including signal generators, amplifiers, spectrum analyzers, vector network analyzers (VNAs), power sensors, and power meters from leading manufacturers.
Whether you are measuring amplifier to gain compression, verifying specifications, or evaluating overall RF system performance, ATEC can help you find the right equipment for your testing requirements.
RF Signal Generators
RF Amplifiers
Spectrum Analyzers
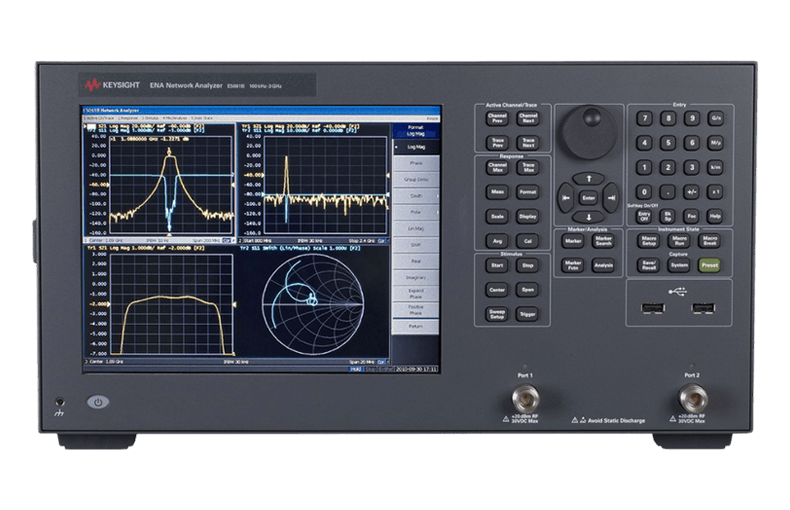
Vector Network Analyzers (VNAs)
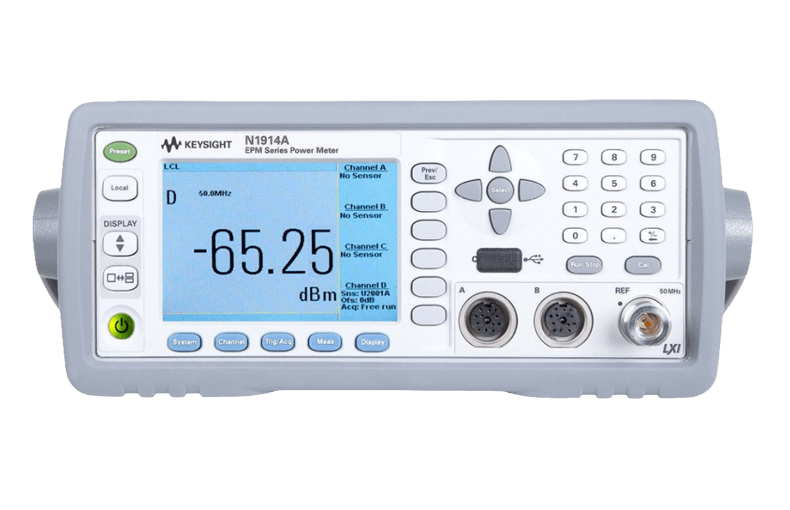
RF Power Meters & Sensors
Posted October 07, 2026